Native memory leak in a cloud environment
A Java project with published container image that contains intentionally leaky native code to observe symptoms of a memory leak in Java in podman/docker or Kubernetes.
Native code intentionally “leaks” provided number of megabytes in a loop. The project runs by default with -XX:NativeMemoryTracking=summary enabled.
I wanted to observe how JVM will report native memory, crash and what pod and JVM metrics will look like.
Java doesn’t allocate many objects, almost none. This is pure Java project without any frameworks, and it runs as java -jar, except location of the native library needs to specified (see run.sh).
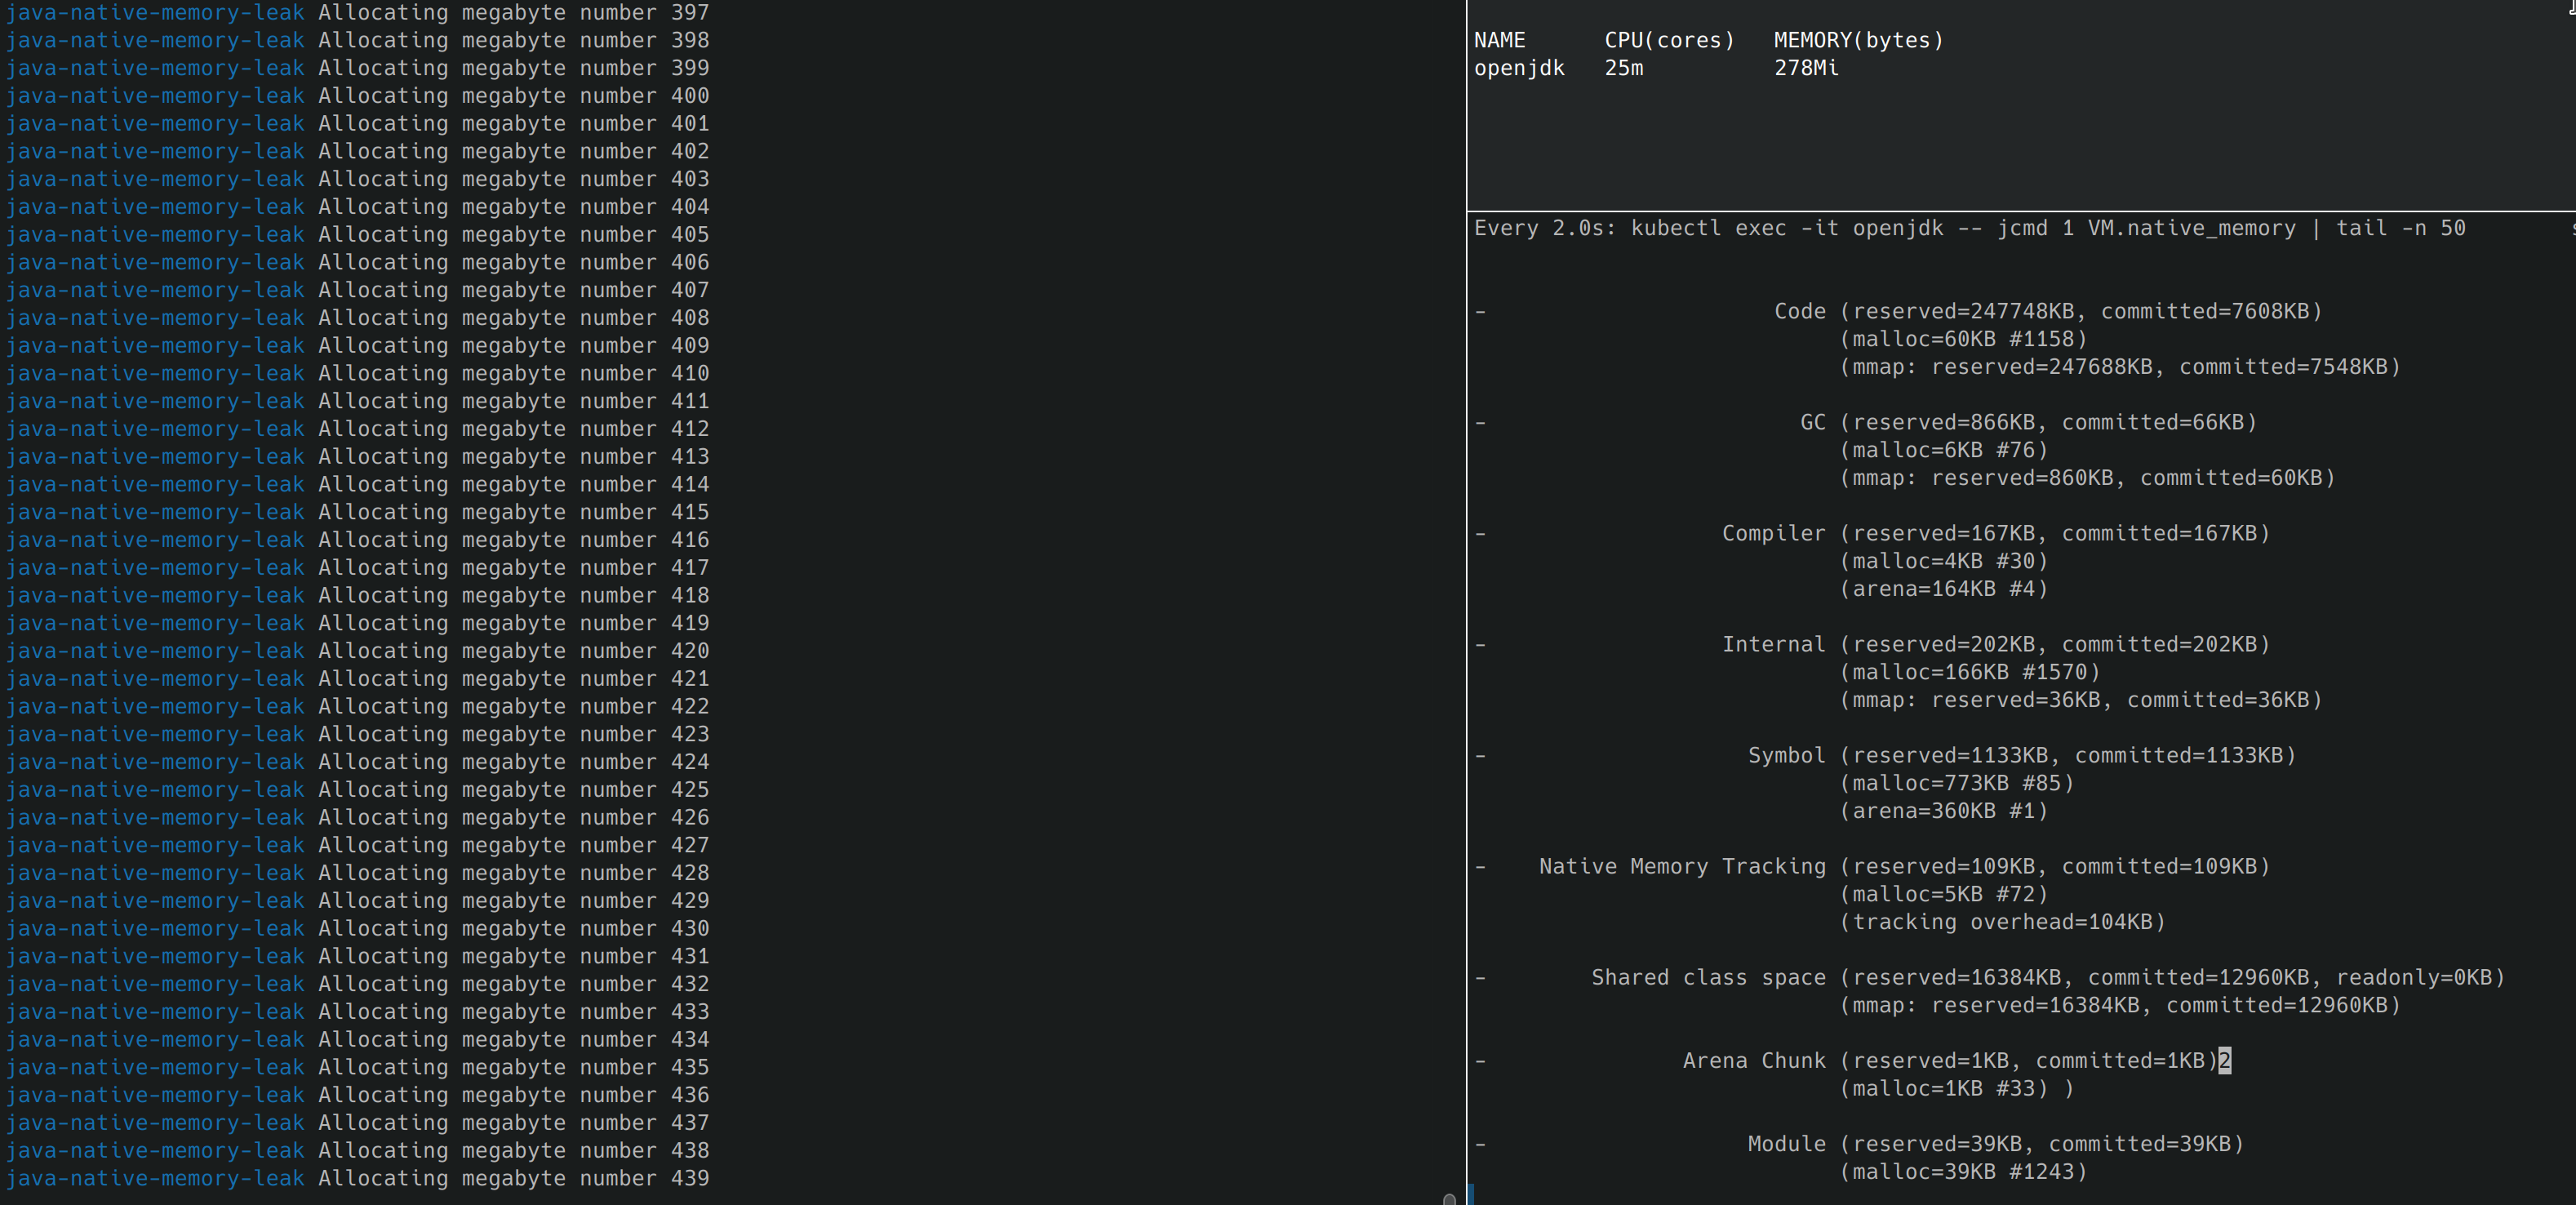
When I started the pod in Kubernetes and executed jcmd inside the pod:
kubectl apply -f pod.yaml
watch -d 'kubectl exec -it openjdk -- jcmd 1 VM.native_memory | tail -n 50'
I observed that the memory footprint remains constant for almost all areas, indicating that the JVM is unable to spot any memory leaks from the native memory allocated by an external library.
Yet, memory consumed by the pod is constantly increasing
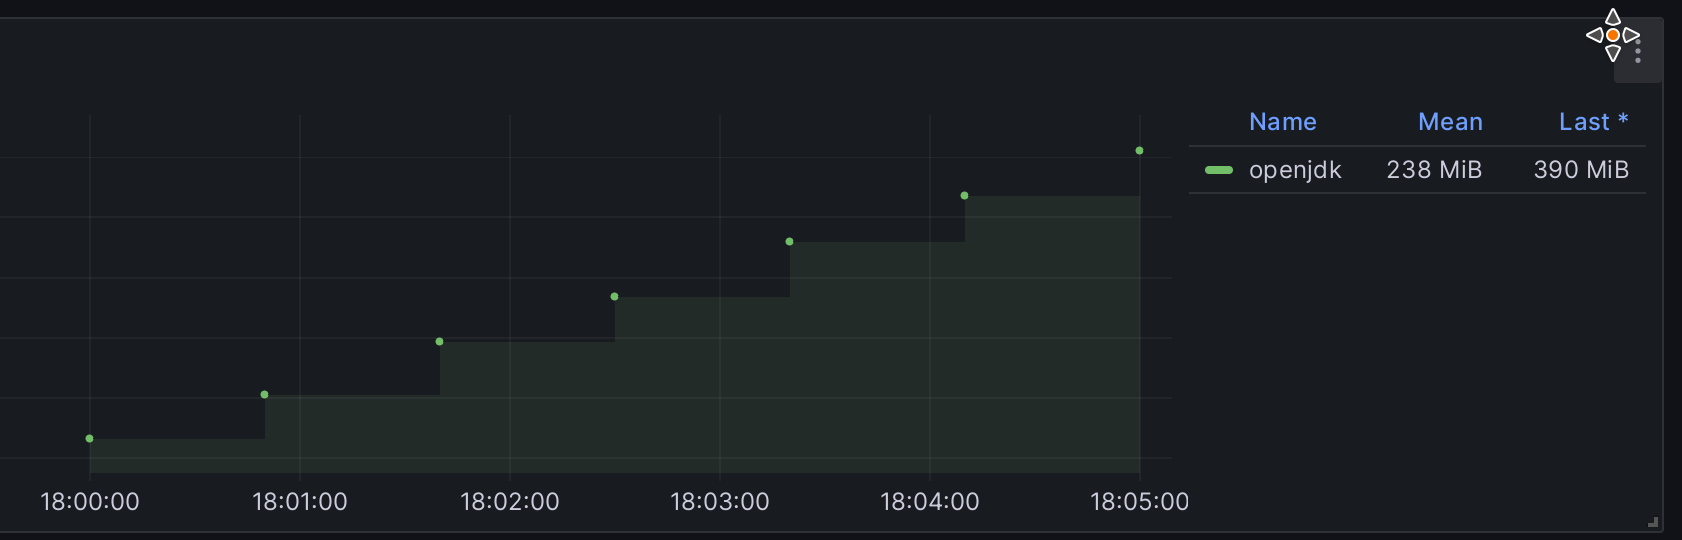
The native library is directed to allocate 1 MB 1024 times within a pod with a 1 GB limit. Consequently, this ultimately results in an Out-Of-Memory (OOM) event leading to termination of the process, even though the JVM is not the root cause of the issue.
❯ kgp
NAME      READY   STATUS      RESTARTS   AGE
openjdk   0/1     OOMKilled   0          19m
To identify a native code leaking memory, we must compare memory used by the JVM, often it’s represented as “heap area” and “non-heap area” to pod memory usage.